Active Systems
Season Archive
Monthly Summary
Outlooks
Discussions
Satellite
Radar
Model Animations
Sea Surface Temps
Origins
Change zoom level:
Basin
|
1
|
2
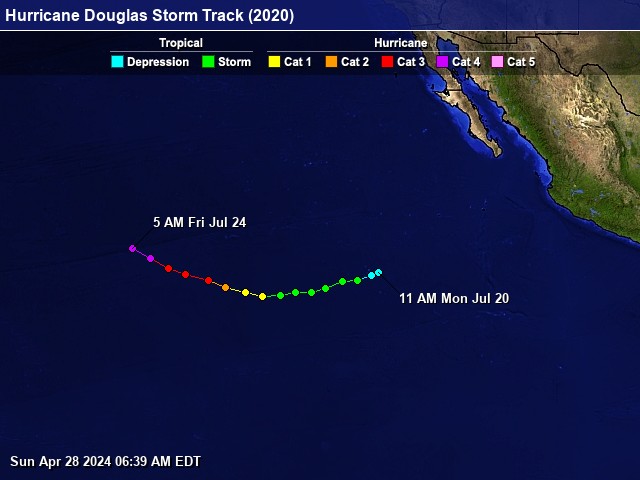
System Track (2020)
Adv #
Advisory Date
(UTC)
Name
(UTC)
Position
Direction
Speed
mph (kts)
Pressure
mb (in)
Winds
mph (kts)
Lat
Lon
16
0900 FRI JUL 24
Hurricane
Douglas
15.7N
140.3W
WNW
18 (16)
954 (28.17)
130 (113)
15
0300 FRI JUL 24
Hurricane
Douglas
14.9N
138.8W
WNW
18 (16)
954 (28.17)
130 (113)
14
2100 THU JUL 23
Hurricane
Douglas
14.1N
137.3W
WNW
18 (16)
959 (28.32)
125 (108)
13
1500 THU JUL 23
Hurricane
Douglas
13.6N
135.9W
WNW
20 (17)
964 (28.47)
120 (104)
12
0900 THU JUL 23
Hurricane
Douglas
13.1N
134W
WNW
17 (15)
967 (28.56)
120 (104)
11
0300 THU JUL 23
Hurricane
Douglas
12.5N
132.6W
WNW
17 (15)
982 (29)
100 (87)
10
2100 WED JUL 22
Hurricane
Douglas
12.1N
130.9W
W
16 (14)
989 (29.21)
80 (69)
9
1500 WED JUL 22
Hurricane
Douglas
11.8N
129.5W
W
15 (13)
993 (29.32)
75 (65)
8
0900 WED JUL 22
Tropical Storm
Douglas
11.9N
128W
W
14 (12)
998 (29.47)
65 (56)
7
0300 WED JUL 22
Tropical Storm
Douglas
12.1N
126.7W
W
14 (12)
998 (29.47)
65 (56)
6
2100 TUE JUL 21
Tropical Storm
Douglas
12.1N
125.4W
WSW
15 (13)
998 (29.47)
65 (56)
5
1500 TUE JUL 21
Tropical Storm
Douglas
12.4N
124.2W
WSW
15 (13)
998 (29.47)
65 (56)
4
0900 TUE JUL 21
Tropical Storm
Douglas
13N
122.8W
WSW
14 (12)
999 (29.5)
60 (52)
3
0300 TUE JUL 21
Tropical Storm
Douglas
13.1N
121.6W
WSW
10 (9)
1006 (29.71)
40 (35)
2
2100 MON JUL 20
Tropical Depression
Eight-E
13.5N
120.4W
SW
7 (6)
1007 (29.74)
35 (30)
1
1500 MON JUL 20
Tropical Depression
Eight-E
13.7N
119.8W
WSW
7 (6)
1008 (29.77)
35 (30)
©2024 Tropical Weather Center
Powered by
HAMweather